Note
Click here to download the full example code
HRF models
Example to illutrate the different HRF model in HemoLearn.
Contents
# Authors: Hamza Cherkaoui <hamza.cherkaoui@inria.fr>
# License: BSD (3-clause)

import os
import time
import numpy as np
import matplotlib.pyplot as plt

from hemolearn.hrf_model import scaled_hrf, hrf_3_basis, hrf_2_basis
Create plotting directory
plot_dir = 'plots'
if not os.path.exists(plot_dir):
    os.makedirs(plot_dir)
Construct the HRFs
TR = 0.5
n_times_atom = 60

_xticks = [0, int(n_times_atom / 2.0), int(n_times_atom)]
_xticks_labels = [0,
    time.strftime("%Ss", time.gmtime(int(TR * n_times_atom / 2.0))),
    time.strftime("%Ss", time.gmtime(int(TR * n_times_atom)))
    ]

basis_3 = hrf_3_basis(TR, n_times_atom)
hrf_3_basis_ = np.array([1.0, 0.5, 0.5]).dot(basis_3)

basis_2 = hrf_2_basis(TR, n_times_atom)
hrf_2_basis_ = np.array([1.0, 0.5]).dot(basis_2)

delta = 1.0
scaled_hrf_ = scaled_hrf(delta, TR, n_times_atom)
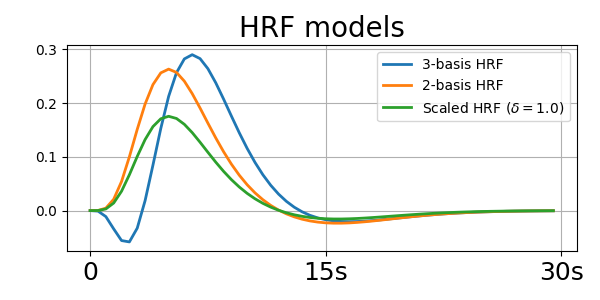
Plot all the HRF models
_, axis = plt.subplots(1, 1, figsize=(6, 3))
axis.plot(hrf_3_basis_.T, lw=2.0, label="3-basis HRF")
axis.plot(hrf_2_basis_.T, lw=2.0, label="2-basis HRF")
axis.plot(scaled_hrf_, lw=2.0, label=r"Scaled HRF ($\delta=1.0$)")
axis.set_xticks(_xticks)
axis.set_xticklabels(_xticks_labels, fontsize=18)
axis.set_title("HRF models", fontsize=20)
plt.grid()
plt.legend()
plt.tight_layout()
filename = os.path.join(plot_dir, 'hrf_model.png')
print(f"Saving plot under '{filename}'")
plt.savefig(filename, dpi=200)

Out:
Saving plot under 'plots/hrf_model.png'
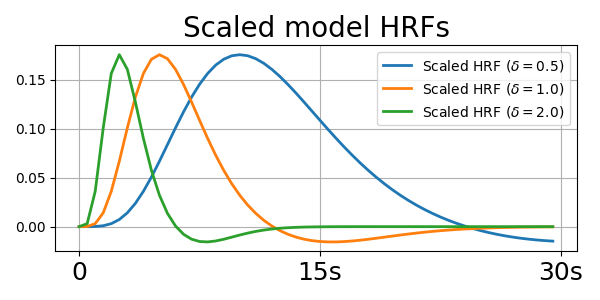
Plot different scaled model HRFs
_, axis = plt.subplots(1, 1, figsize=(6, 3))
axis.plot(scaled_hrf(0.5, TR, n_times_atom), lw=2.0,
          label=r"Scaled HRF ($\delta={0.5}$)")
axis.plot(scaled_hrf(1.0, TR, n_times_atom), lw=2.0,
          label=r"Scaled HRF ($\delta={1.0}$)")
axis.plot(scaled_hrf(2.0, TR, n_times_atom), lw=2.0,
          label=r"Scaled HRF ($\delta={2.0}$)")
axis.set_xticks(_xticks)
axis.set_xticklabels(_xticks_labels, fontsize=18)
axis.set_title("Scaled model HRFs", fontsize=20)
plt.grid()
plt.legend()
plt.tight_layout()
filename = os.path.join(plot_dir, 'scaled_hrf_model.png')
print(f"Saving plot under '{filename}'")
plt.savefig(filename, dpi=200)

Out:
Saving plot under 'plots/scaled_hrf_model.png'
Total running time of the script: ( 0 minutes 0.575 seconds)
