Note
Click here to download the full example code
Synthetic fMRI data example
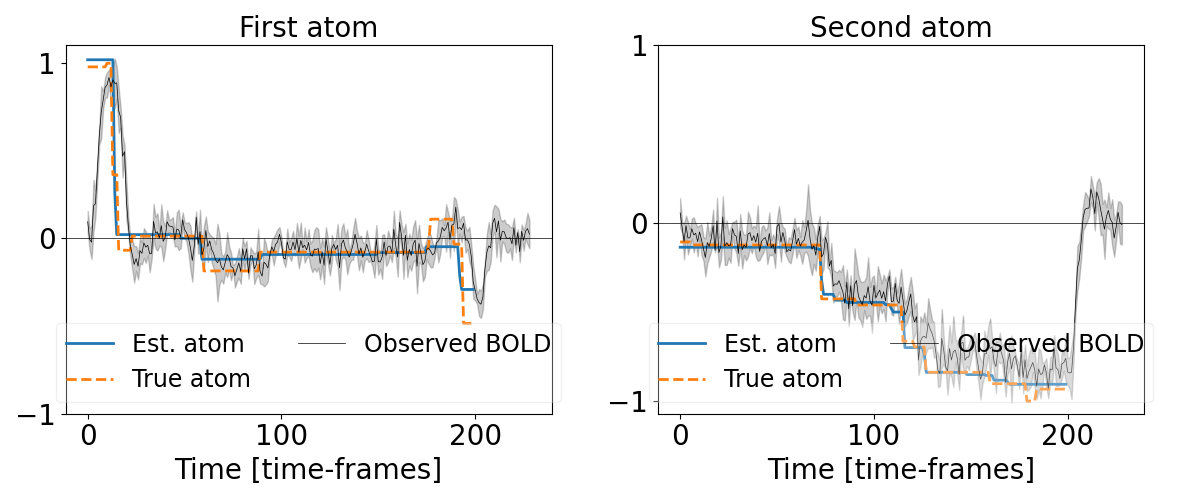
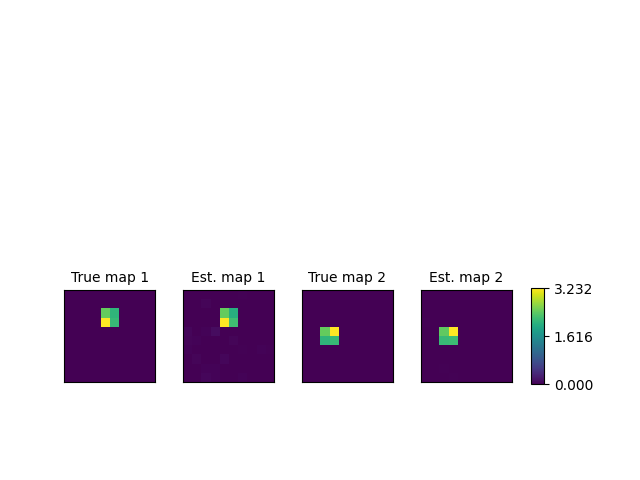
Example to recover the different neural temporal activities, the associated functional networks maps and the HRFs per ROIs in the fMRI data, on simulated fMRI data.
Contents
# Authors: Hamza Cherkaoui <hamza.cherkaoui@inria.fr>
# License: BSD (3-clause)

import os
import numpy as np
import matplotlib.pyplot as plt

from hemolearn.simulated_data import simulated_data
from hemolearn import deconvolution
Create plotting directory
plot_dir = 'plots'
if not os.path.exists(plot_dir):
    os.makedirs(plot_dir)
Generate the synthetic data
TR = 1.0
n_voxels, n_atoms, n_times_valid, n_times_atom, snr = 100, 2, 200, 30, 1.0
noisy_X, _, u, v, z, hrf_rois = simulated_data(n_voxels=n_voxels,
                                               n_times_valid=n_times_valid,
                                               n_times_atom=n_times_atom,
                                               snr=snr)
Distangle the neurovascular coupling from the neural activation
results = deconvolution.multi_runs_blind_deconvolution_multiple_subjects(
                    noisy_X, t_r=TR, hrf_rois=hrf_rois, n_atoms=n_atoms,
                    deactivate_v_learning=True, prox_u='l1-positive-simplex',
                    n_times_atom=n_times_atom, hrf_model='scaled_hrf',
                    lbda_strategy='ratio', lbda=0.5,
                    u_init_type='gaussian_noise', max_iter=30, get_obj=1,
                    raise_on_increase=True, random_seed=None,
                    n_jobs=4, nb_fit_try=4, verbose=0)
z_hat, _, u_hat, a_hat, v_hat, v_init, _, pobj, times = results
z_hat, u_hat, a_hat, v_hat = z_hat[0], u_hat[0], a_hat[0], v_hat[0]
Re-label the components
u_0_true = u[0, :]
u_1_true = u[1, :]
z_0_true = z[0, :].T.ravel()
z_1_true = z[1, :].T.ravel()

u_0_hat = u_hat[0, :]
u_1_hat = u_hat[1, :]
z_0_hat = z_hat[0, :].T.ravel()
z_1_hat = z_hat[1, :].T.ravel()

prod_scal_0 = np.dot(z_0_hat, z_0_true)
prod_scal_1 = np.dot(z_0_hat, z_1_true)
if prod_scal_0 < prod_scal_1:
    tmp = z_0_hat
    z_0_hat = z_1_hat
    z_1_hat = tmp
    tmp = u_0_hat
    u_0_hat = u_1_hat
    u_1_hat = tmp
Plot the temporal activations
plt.figure("Temporal atoms", figsize=(12, 5))
plt.subplot(121)
plt.plot(z_0_hat, lw=2.0, label="Est. atom")
plt.plot(z_0_true, linestyle='--', lw=2.0, label="True atom")
x_0 = noisy_X[np.where(u_0_true > 0)[0], :]
x_0 /= np.repeat(np.max(np.abs(x_0), axis=1)[:, None], noisy_X.shape[1], 1)
t = np.arange(noisy_X.shape[1])
mean_0 = np.mean(x_0, axis=0)
std_0 = np.std(x_0, axis=0)
borders_0 = (mean_0 - std_0, mean_0 + std_0)
plt.plot(mean_0, color='k', lw=0.5, label="Observed BOLD")
plt.fill_between(t, borders_0[0], borders_0[1], alpha=0.2, color='k')
plt.axhline(0.0, color='k', linewidth=0.5)
plt.xticks([0, n_times_valid/2.0, n_times_valid], fontsize=20)
plt.yticks([-1, 0, 1], fontsize=20)
plt.xlabel("Time [time-frames]", fontsize=20)
plt.legend(ncol=2, loc='lower center', fontsize=17, framealpha=0.3)
plt.title("First atom", fontsize=20)
plt.subplot(122)
plt.plot(z_1_hat, lw=2.0, label="Est. atom")
plt.plot(z_1_true, linestyle='--', lw=2.0, label="True atom")
x_1 = noisy_X[np.where(u_1_true > 0)[0], :]
x_1 /= np.repeat(np.max(np.abs(x_1), axis=1)[:, None], noisy_X.shape[1], 1)
mean_1 = np.mean(x_1, axis=0)
std_1 = np.std(x_1, axis=0)
borders_1 = (mean_1 - std_1, mean_1 + std_1)
plt.plot(mean_1, color='k', lw=0.5, label="Observed BOLD")
plt.fill_between(t, borders_1[0], borders_1[1], alpha=0.2, color='k')
plt.axhline(0.0, color='k', linewidth=0.5)
plt.xticks([0, n_times_valid/2.0, n_times_valid], fontsize=20)
plt.yticks([-1, 0, 1], fontsize=20)
plt.xlabel("Time [time-frames]", fontsize=20)
plt.legend(ncol=2, loc='lower center', fontsize=17, framealpha=0.3)
plt.title("Second atom", fontsize=20)
plt.tight_layout()
filename = "activations.png"
filename = os.path.join(plot_dir, filename)
plt.savefig(filename, dpi=150)
print("Saving plot under '{0}'".format(filename))

Out:
Saving plot under 'plots/activations.png'
Plot the spatial maps
fig, axes = plt.subplots(nrows=1, ncols=4)
len_square = int(np.sqrt(n_voxels))
l_u = [u_0_true.reshape(len_square, len_square),
       u_0_hat.reshape(len_square, len_square),
       u_1_true.reshape(len_square, len_square),
       u_1_hat.reshape(len_square, len_square)]
l_max_u = [np.max(u) for u in l_u]
max_u = np.max(l_max_u)
amax_u = np.argmax(l_max_u)
l_name = ["True map 1", "Est. map 1", "True map 2", "Est. map 2"]
l_im = []
for ax, u, name in zip(axes.flat, l_u, l_name):
    l_im.append(ax.matshow(u))
    ax.set_title(name, fontsize=10)
    ax.set_xticks([])
    ax.set_yticks([])
fig.subplots_adjust(bottom=0.1, top=0.5, left=0.1, right=0.8,
                    wspace=0.3, hspace=0.2)
cbar_ax = fig.add_axes([0.83, 0.2, 0.02, 0.2])
cbar = fig.colorbar(l_im[amax_u], cax=cbar_ax)
cbar.set_ticks(np.linspace(0.0, max_u, 3))
filename = "spatial_maps.png"
filename = os.path.join(plot_dir, filename)
plt.savefig(filename, dpi=150)
print("Saving plot under '{0}'".format(filename))

Out:
Saving plot under 'plots/spatial_maps.png'
Total running time of the script: ( 0 minutes 3.767 seconds)
