Note
Click here to download the full example code
Real fMRI data example
Example to recover the different neural temporal activities, the associated functional networks maps and the HRFs per ROIs in the fMRI data, on the ADHD dataset resting-state.
Contents
# Authors: Hamza Cherkaoui <hamza.cherkaoui@inria.fr>
# License: BSD (3-clause)

import os
from nilearn import datasets
import numpy as np

from hemolearn import BDA, plotting
Create plotting directory
plot_dir = 'plots'
if not os.path.exists(plot_dir):
    os.makedirs(plot_dir)
Fetch fMRI subjects
seed, TR, n_subjects = 0, 2.0, 4
adhd_dataset = datasets.fetch_adhd(n_subjects=n_subjects)
func_fnames = adhd_dataset.func[:n_subjects]
confound_fnames = adhd_dataset.confounds[:n_subjects]
Out:
/home/hcherkaoui/.local/lib/python3.6/site-packages/nilearn/datasets/func.py:241: VisibleDeprecationWarning: Reading unicode strings without specifying the encoding argument is deprecated. Set the encoding, use None for the system default.
  dtype=None)
Distangle the neurovascular coupling from the neural activation
bda = BDA(n_atoms=10, t_r=TR, n_times_atom=30, lbda=0.1, max_iter=50,
          standardize=True, shared_spatial_maps=True, random_state=seed,
          verbose=1)
a_hat_img = bda.fit_transform(func_fnames, confound_fnames=confound_fnames)
Out:
[BDA] Clean subject '/home/hcherkaoui/nilearn_data/adhd/data/0010042/0010042_rest_tshift_RPI_voreg_mni.nii.gz'
[BDA] Clean subject '/home/hcherkaoui/nilearn_data/adhd/data/0010064/0010064_rest_tshift_RPI_voreg_mni.nii.gz'
[BDA] Clean subject '/home/hcherkaoui/nilearn_data/adhd/data/0010128/0010128_rest_tshift_RPI_voreg_mni.nii.gz'
[BDA] Clean subject '/home/hcherkaoui/nilearn_data/adhd/data/0021019/0021019_rest_tshift_RPI_voreg_mni.nii.gz'
[BDA] Running 1 fit(s) on 4 subject(s) in series
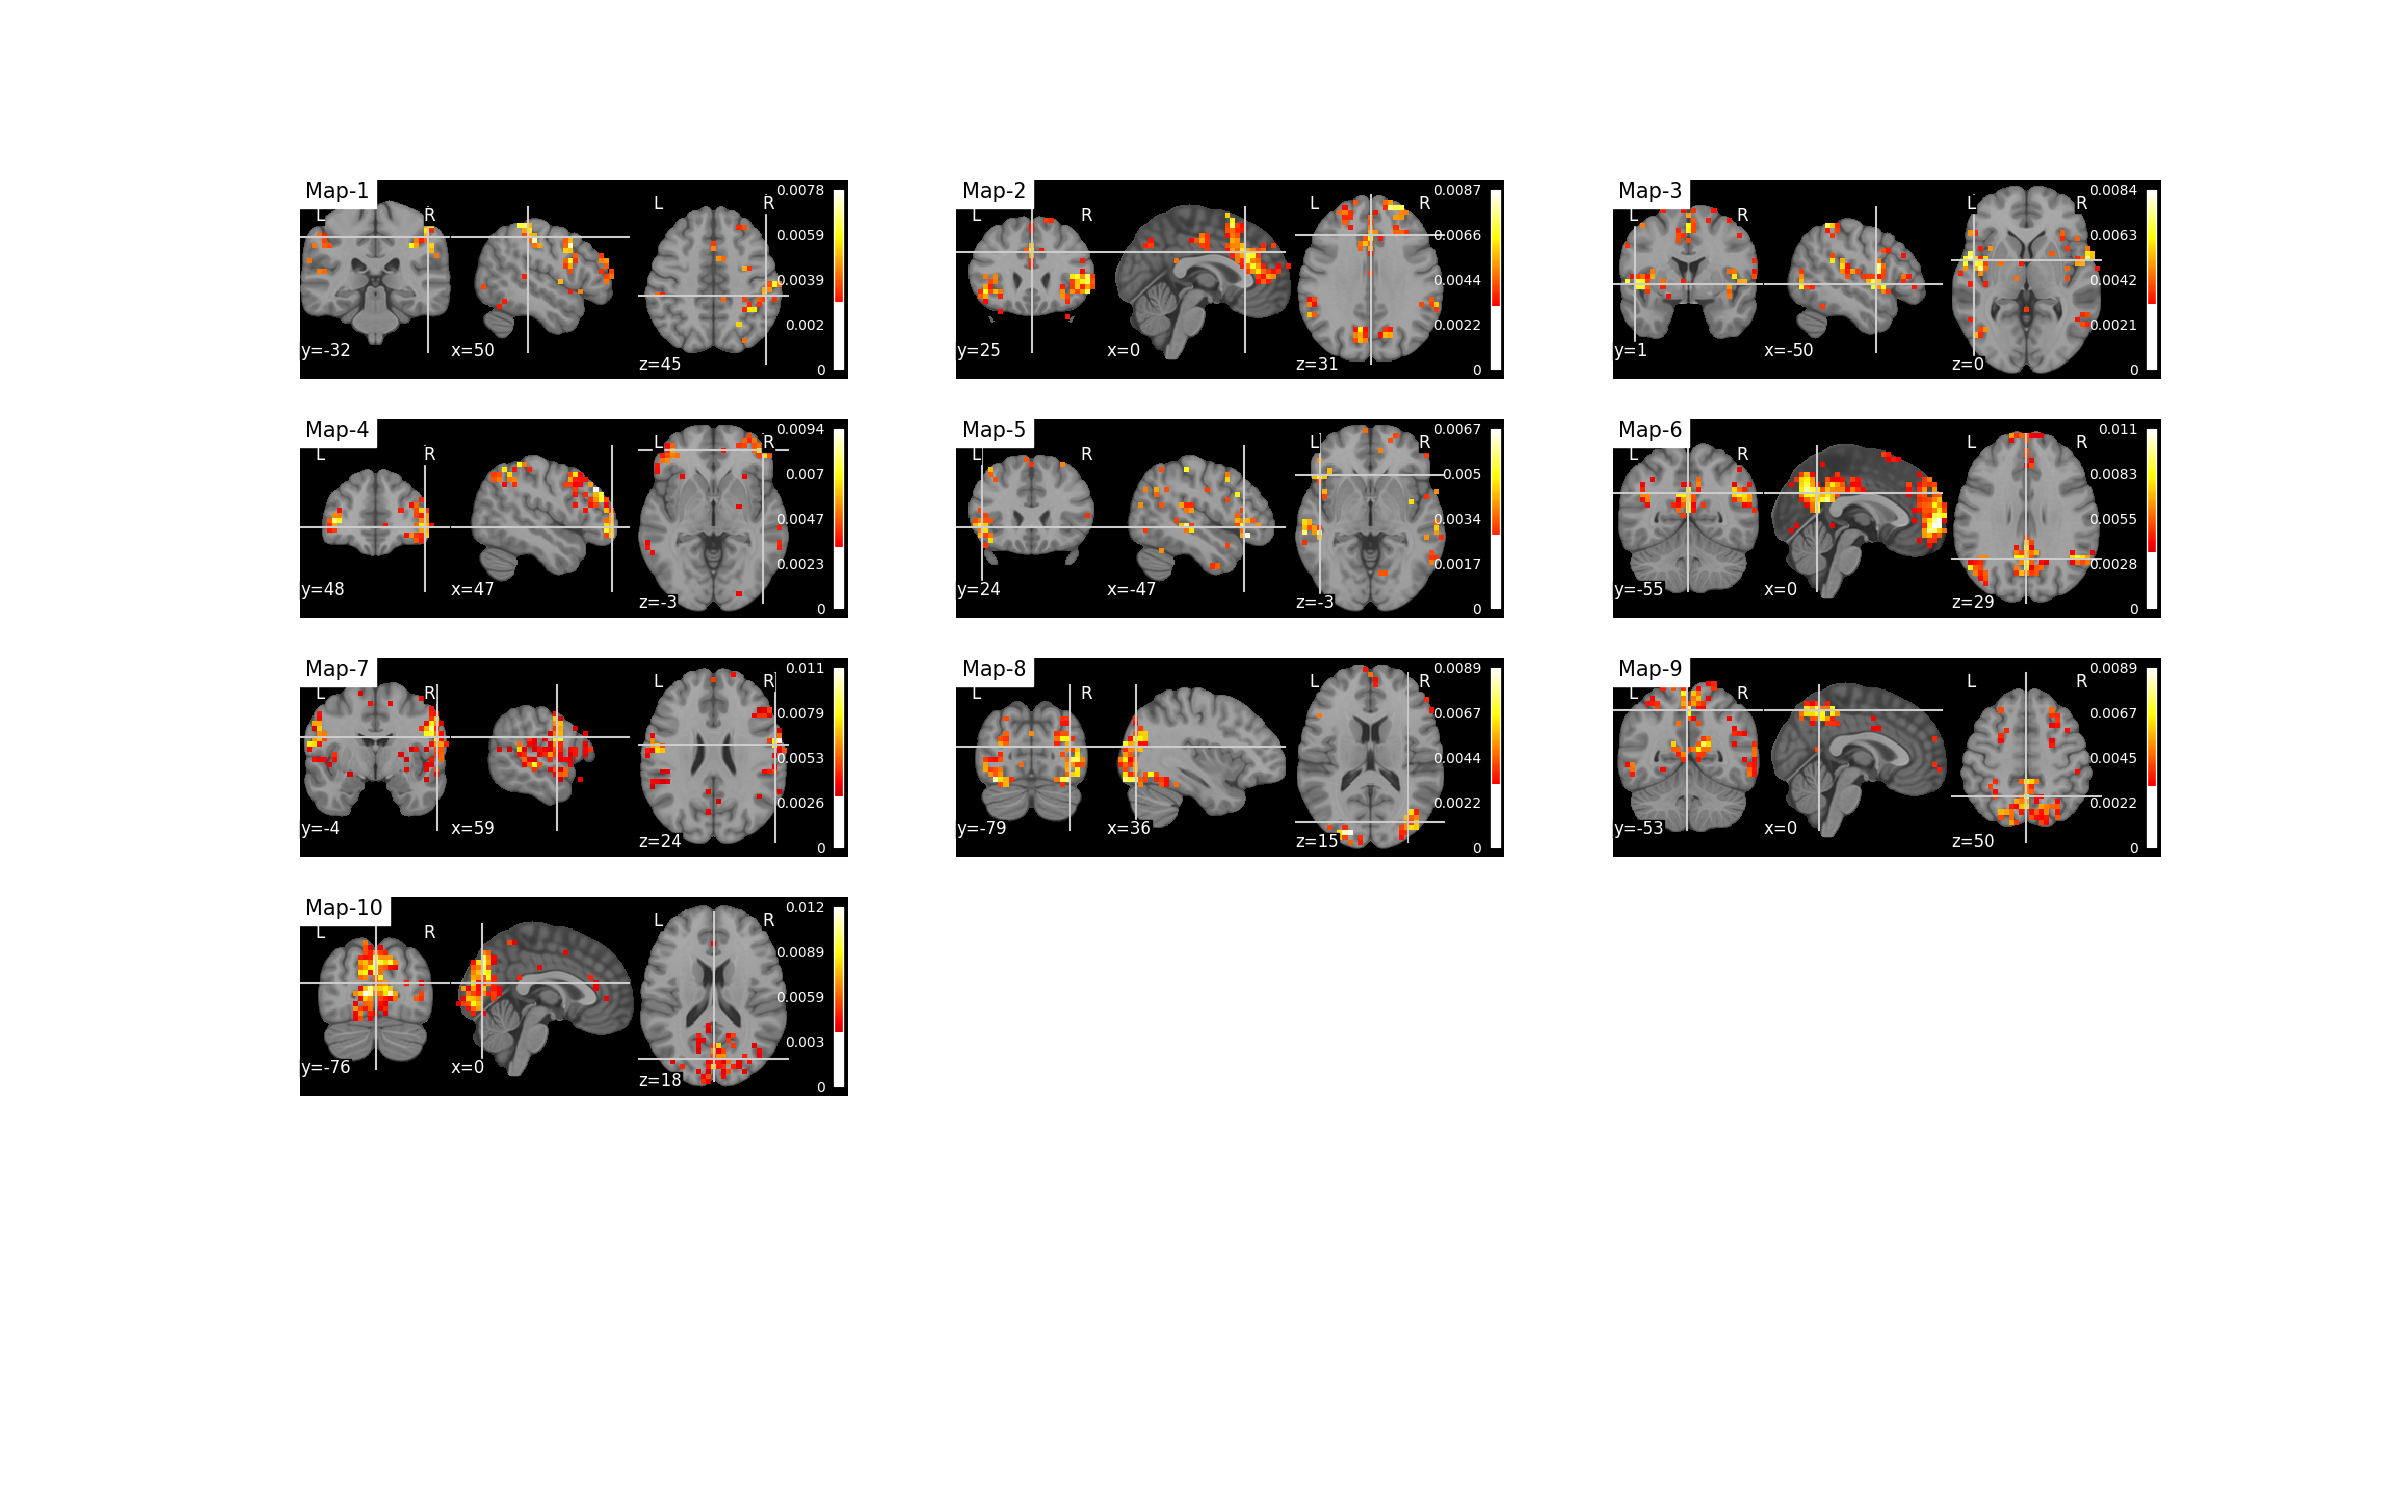
Plot the spatial maps
filename = os.path.join(plot_dir, f'spatial_maps.png')
plotting.plot_spatial_maps(bda.u_hat_img, filename=filename,
                           perc_voxels_to_retain='1%', verbose=True)
Out:
Saving plot under 'plots/spatial_maps.png'
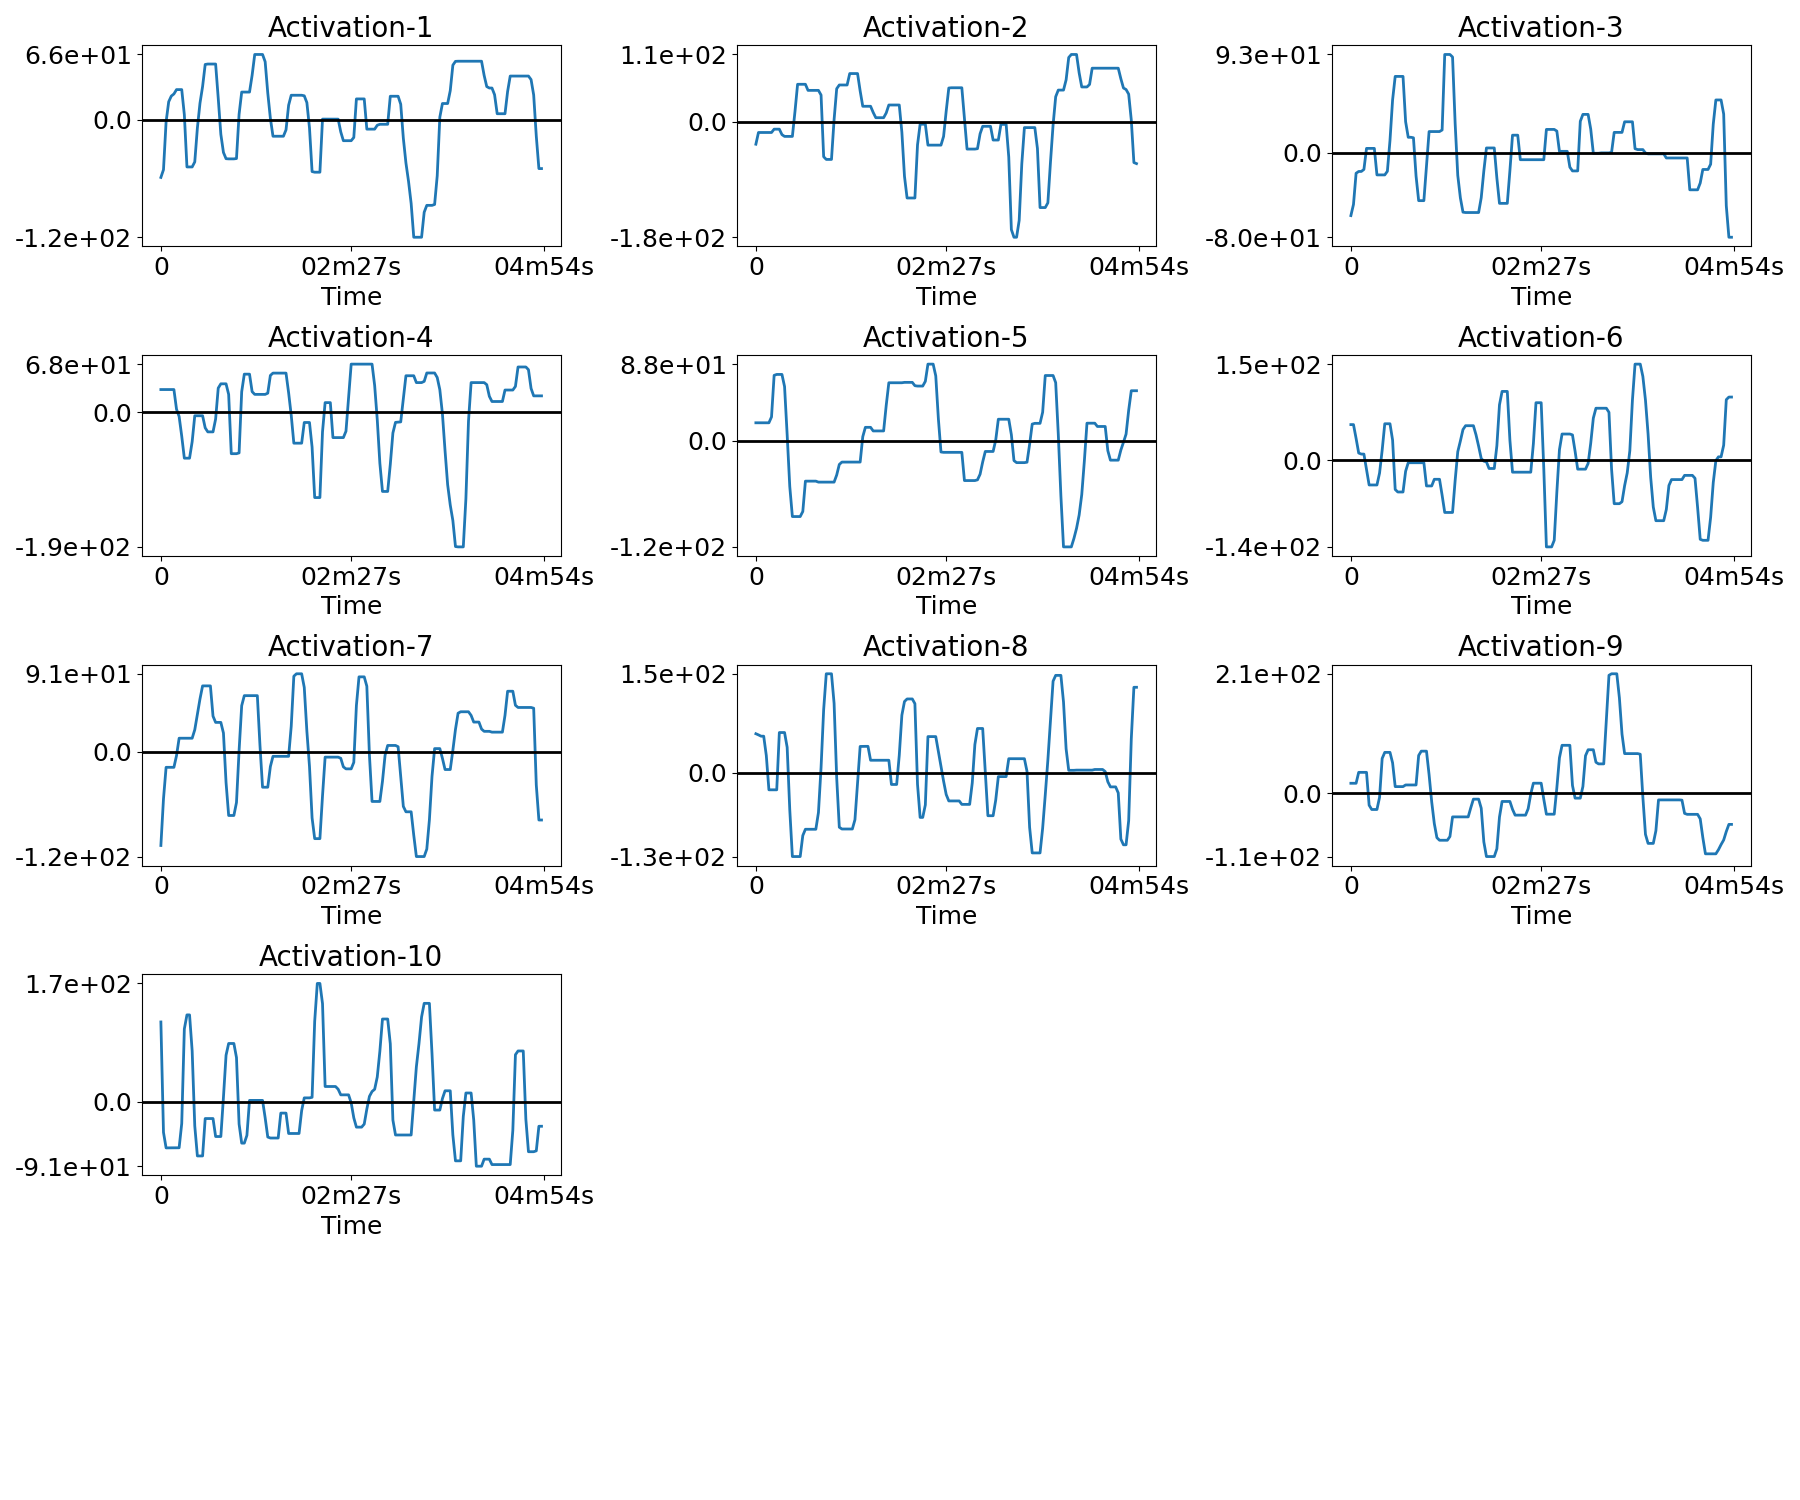
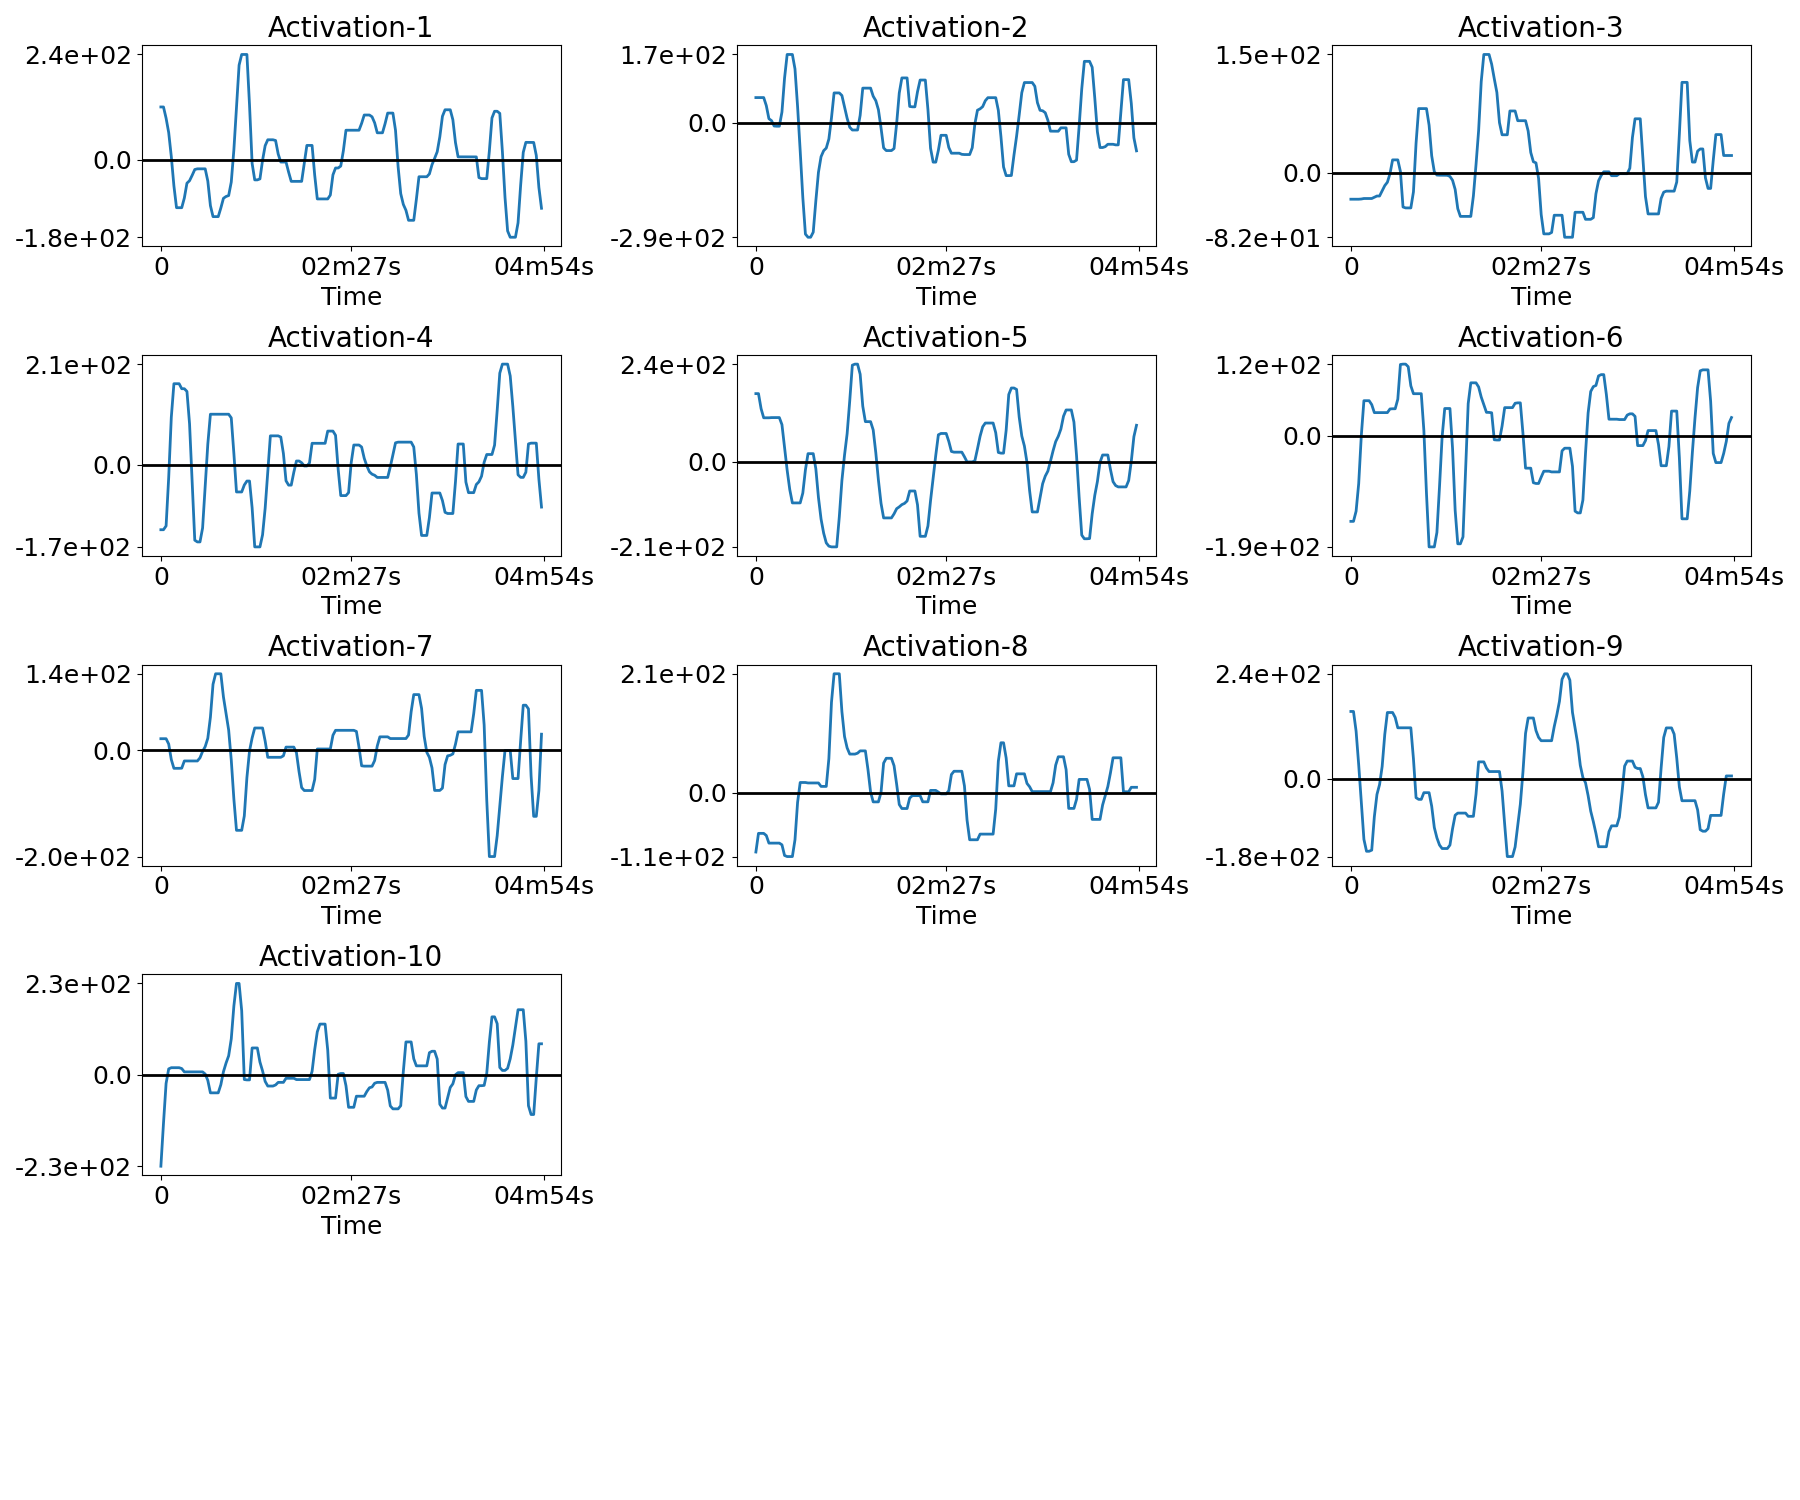
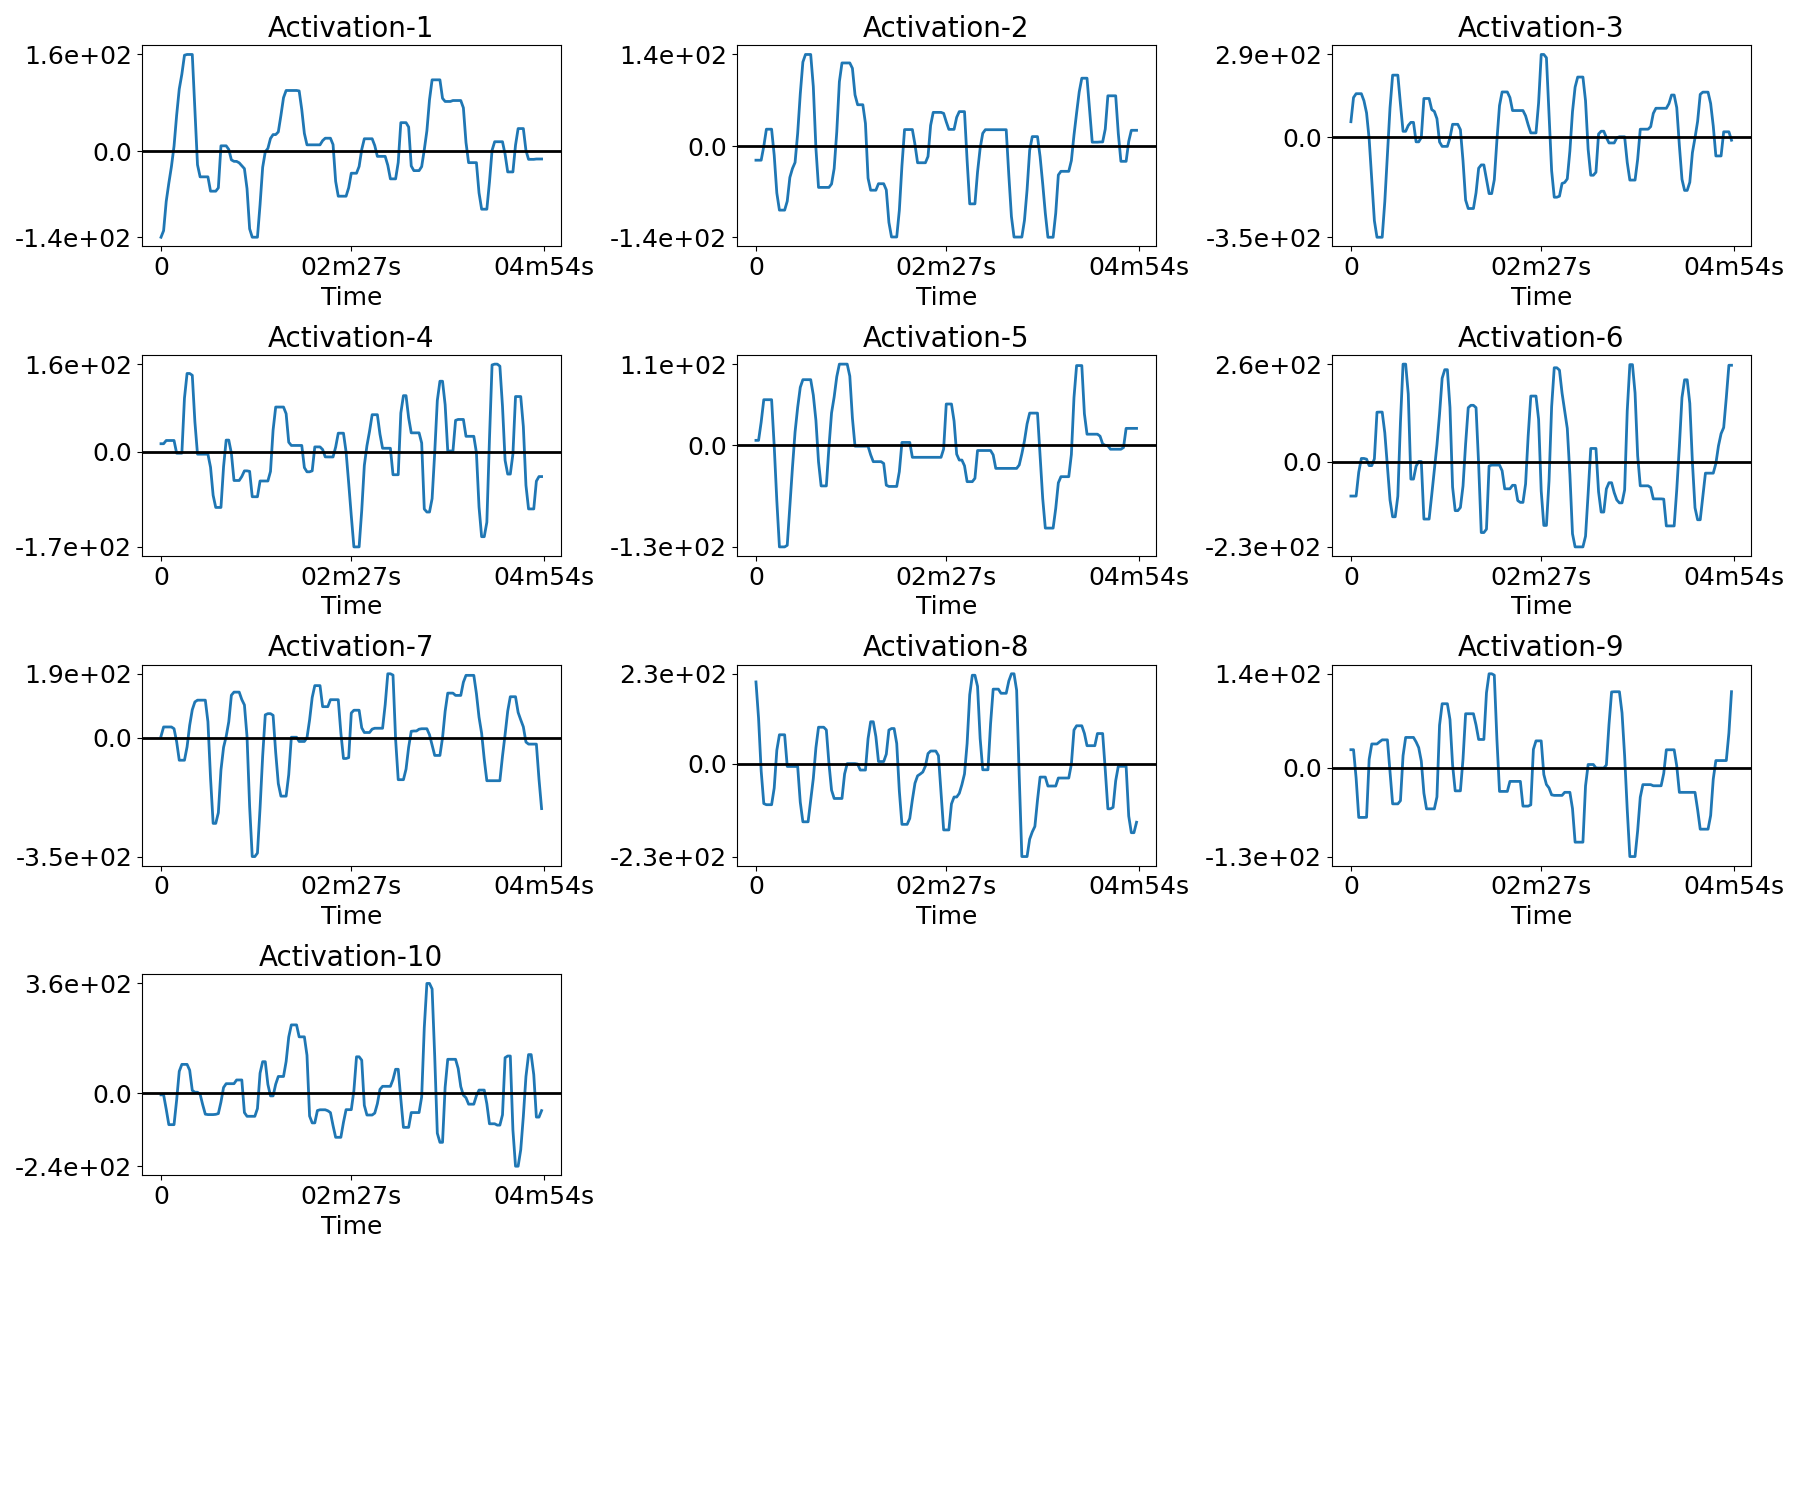
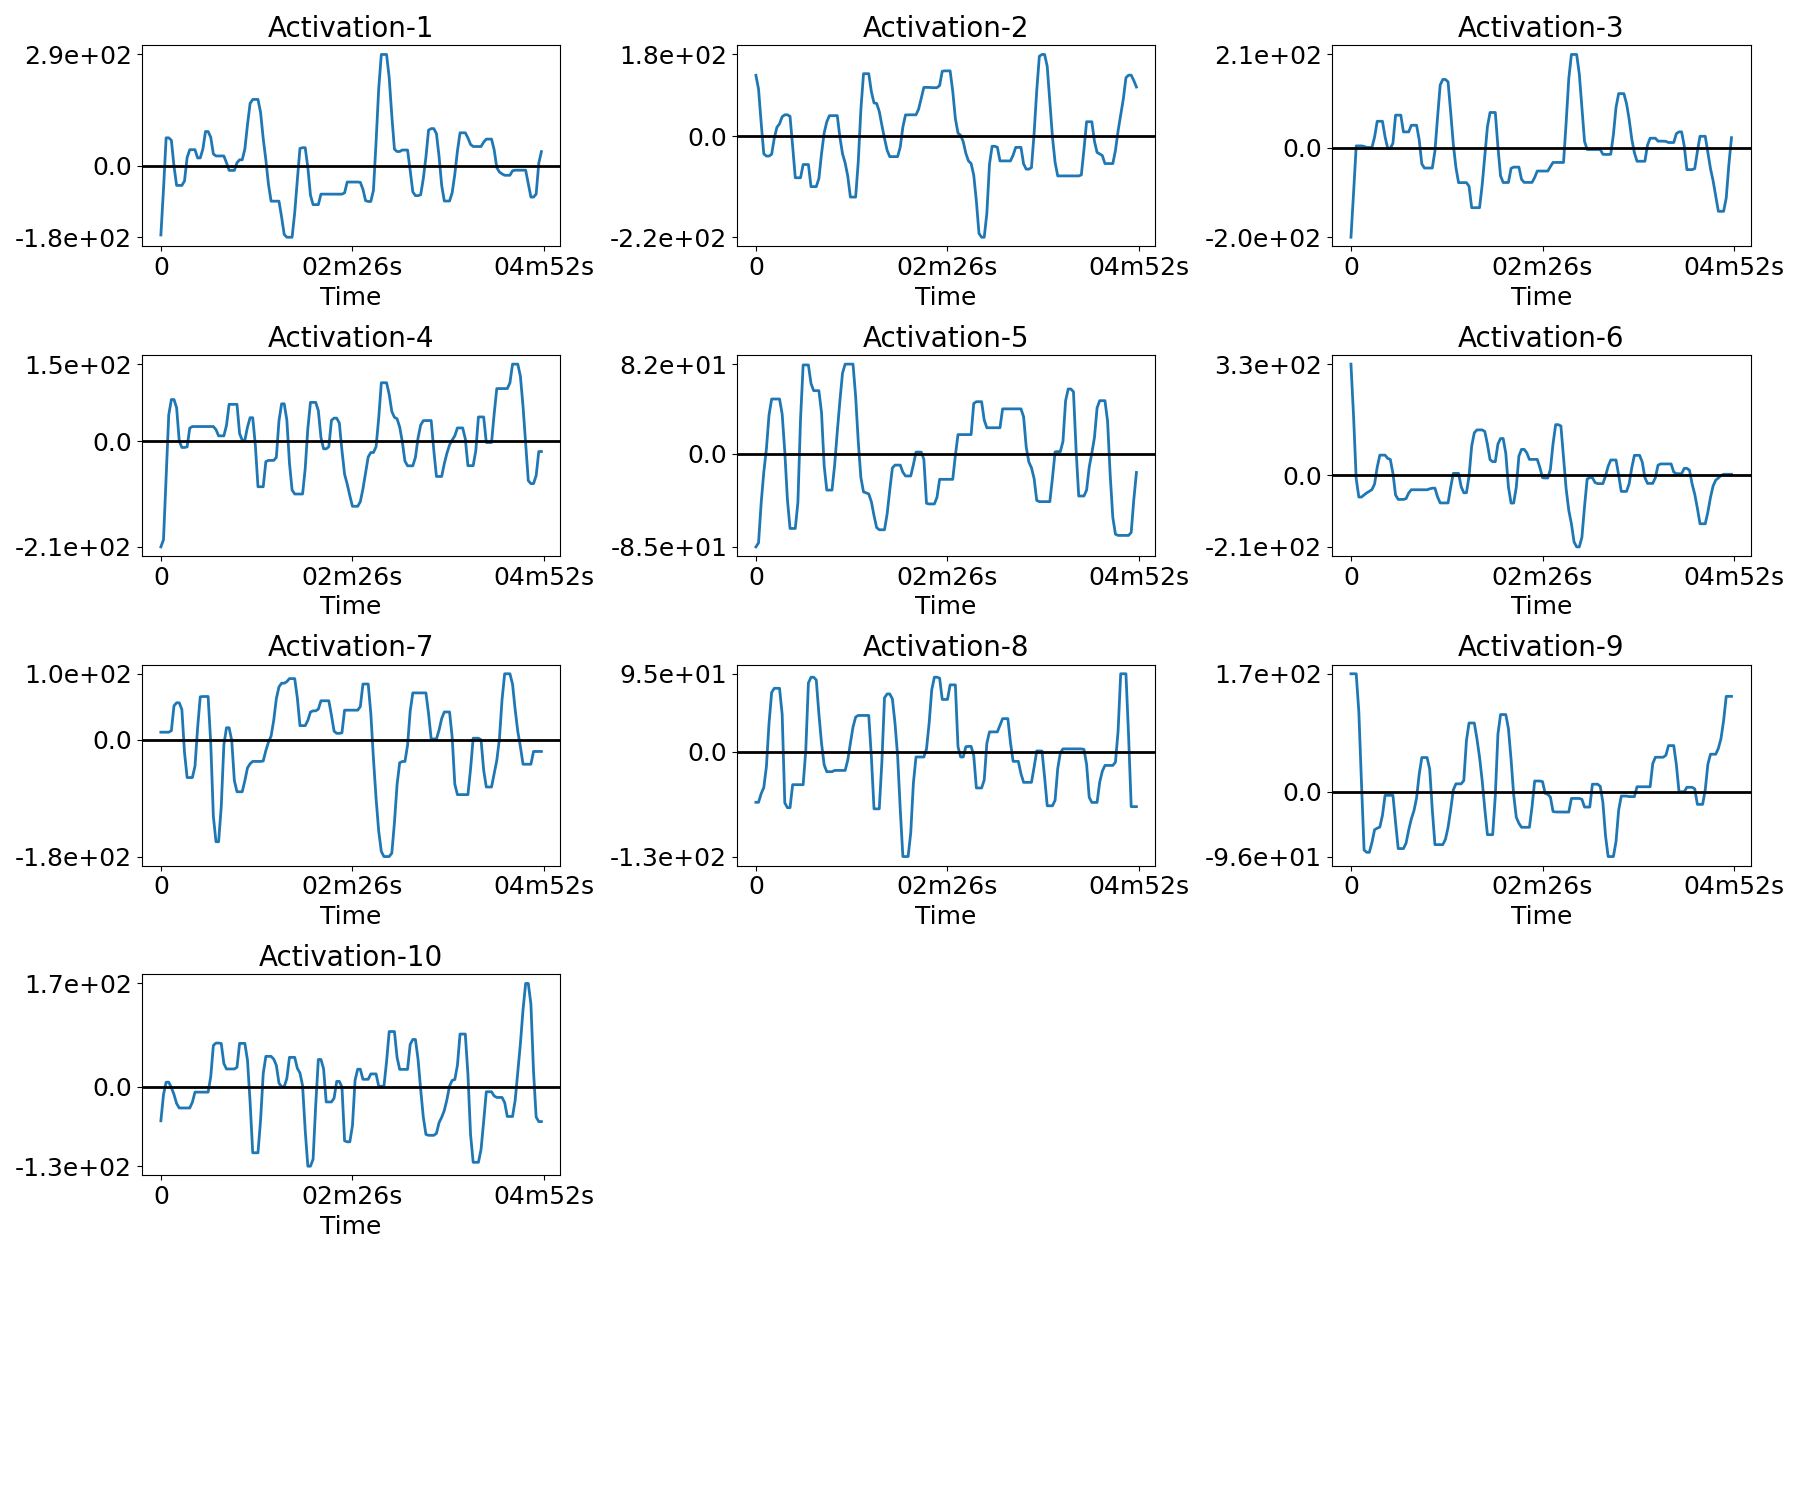
Plot the temporal activations
for n in range(n_subjects):
    filename = os.path.join(plot_dir, f'activations_{n}.png')
    plotting.plot_temporal_activations(bda.z_hat[n], TR, filename=filename,
                                       verbose=True)
Out:
Saving plot under 'plots/activations_0.png'
Saving plot under 'plots/activations_1.png'
Saving plot under 'plots/activations_2.png'
Saving plot under 'plots/activations_3.png'
Plot vascular maps
vmax = np.max([np.max(bda.a_hat[n]) for n in range(n_subjects)])
for n in range(n_subjects):
    filename = os.path.join(plot_dir, f'vascular_maps_{n}.png')
    plotting.plot_vascular_map(a_hat_img[n], display_mode='z',
                               cut_coords=np.linspace(-30, 60, 5),
                               filename=filename, vmax=vmax, verbose=True)
Out:
/home/hcherkaoui/.local/lib/python3.6/site-packages/nilearn/plotting/img_plotting.py:341: FutureWarning: Default resolution of the MNI template will change from 2mm to 1mm in version 0.10.0
  anat_img = load_mni152_template()
Saving plot under 'plots/vascular_maps_0.png'
Saving plot under 'plots/vascular_maps_1.png'
Saving plot under 'plots/vascular_maps_2.png'
Saving plot under 'plots/vascular_maps_3.png'
Total running time of the script: ( 0 minutes 25.358 seconds)

